


Tuesday, January 01, 2002
Oahu Weather


WindAlert current conditions and flow
Traffic Cams (click Kaneohe to check cloud base on the Koolaus)
Oahu 7-day Zone Forecast
University of Hawaii Weather Department
Earth GFS Animation
How to read a Skew-T
Another explanation
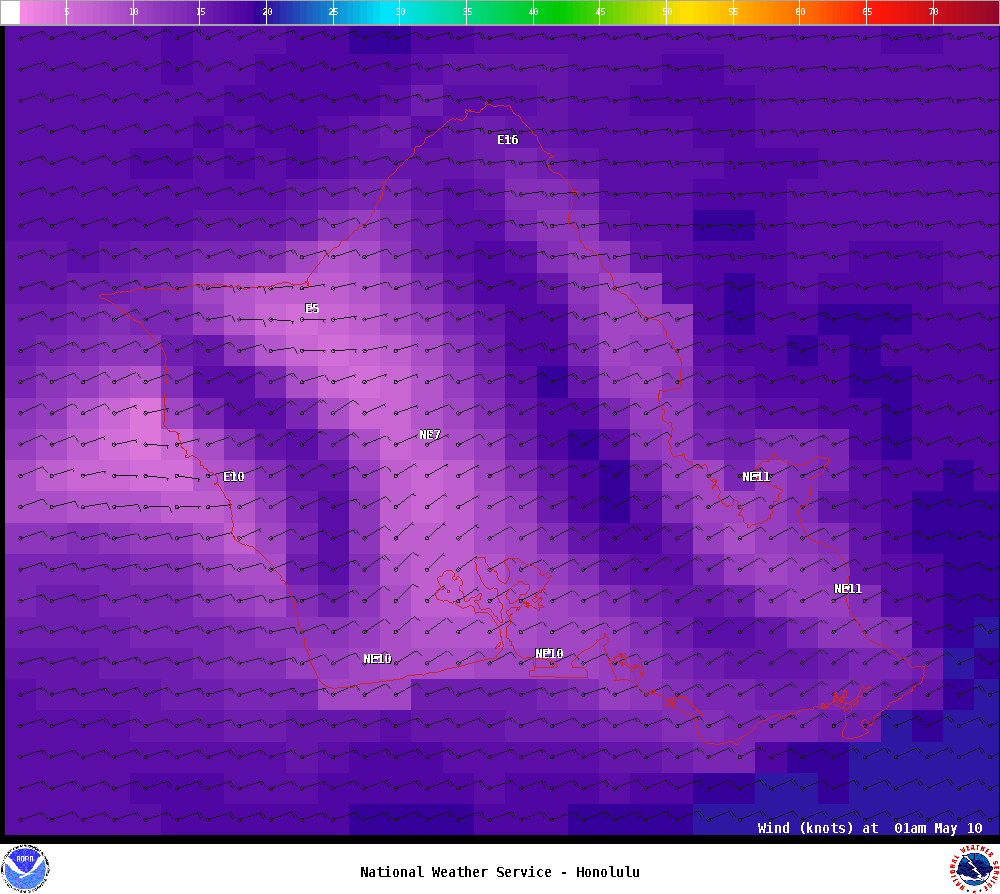
WRF-ARW 10m wind forecast
WRF-NMM 10m wind forecast
MM5 10m wind forecast
Hourly wind report
Half-hourly wind plot
UH Molokai Radar loop
NWS Mobile Weather Site
Subscribe to:
Post Comments (Atom)
34 comments:
Nanakuli HS weather station
Nanaikapono ES weather station (closer to the beach /sea breeze)
Hawaii Skew-T's and other good stuff linked from here
Better skew-T's and MM5-like plot generation
Pick PHLI for Lihue, and PHTO for Hilo.
Select Type of Plot as GIF: to 700 mb
hourly rain accumulation map
coastal wind obs/fcast
iwindsurf gust nowcast
area forecast discussion
windguru 7 day forecast
airsports 3 day forecast
7 day sunset and LZ-eating tide chart
nws 5 day forecast
statewide windflow graphics for iwindsurf members, which often depicts Mauna Loa influencing strength and direction of Oahu winds. That most massive volcano in world seems to either bend an accelerated "bow" or "side" wave across Oahu or else lulls it out in wind shadow. Historical Oahu-bound hurricane tracks also have appeared to be deflected by Mauna Loa.
free graphic windflow forecast
earlier hourly wind obs (h:25)
-> thermal prediction engine; Hilo airmass
-> thermal prediction engine; Lihue airmass
Click on these to process latest radiosonde info. Best to overtype the url's =80 with expected high temperature, then click again. Find cloudbase prediction, then scan the MSL column vs TI and trig. Trig is the trigger temperature that your thermal has to start off with to reach that height. TI is thermal index, which is how much cooler the surrounding air is vs your airborne thermal. Thermal will keep rising til zero, but you may need -3 or -4 (found at lower levels, if at all) to keep PG aloft.
Without your temp override, only the Trig column is correct. I used to have good luck choosing expected high temp about 3 above NWS forecast, to represent localized baking. If you get that right, and if the radiosonde info is correct, then nothing can prevent the thermal rising to that height that physics predicts, not even weak inversions. Caveat is that our radiosonde launch schedule is about the unluckiest in the world, and tends to give old nighttime data.
So far I can't get this tool's surface temp forecast retreval feature to work for HNL. More background info can be found in http://www.soarforecast.com/README.html and http://www.nauticom.net/www/lhuffman/therm/fore.htm . Note they both express the view that height is the main thing you can predict about thermals, although strength seems related to that.
-> forecast high temps
These forecast highs can be overtyped into thermal calculator above (after you have already run it on default of 80) with specific Makaha, Kaneohe, Kona, or whatever temps. In the future these may be automatically loaded. After 4pm the temps roll over for the next day, which is kinda unlucky timing vs the radiosonde data which only loads daytime info maybe just after 3:30pm (and also 3:30am).
-> UH MM5 wind/rain forecast maps, etc
Above is an experimental weather forecast using extra local info. Most interesting is clicking on the "loops" at the bottom of "wind" and "rain" column. Step thru while watching the timestamps. Also you can bring up other islands, and even misc studies of 3d airflow on leeward sides of HI volcanos (used to be impt for controlling cane fires).
The above uses one of a number of new forecast engines which "try" to take local quirks more into consideration. If I understand correctly, here are common engine acronyms (often seen in the forecast), with my jokey names to try to put them in perspective:
GFS - Global old-Fashioned Standard
NAM - North American Middleaged
MM5 - semi-Mature Micro scale
WRF - Wow Really Futuristic
Usually you get GFS (Iwindsurf, etc). Windguru can use all of them; it does seem to label HI forecasts as GFS, but at times they seem to successfully contradict other GFS labeled forecasts. MM5 is run by UHM/SOEST as above, and sometimes available from the Haleakala Weather Center... although I have set up their "free graphic windflow forecast" link higher up to default to the even more experimental WRF.
BACK TO BASICS: I've been cluttering up this section with esoterics, so maybe will end with a rerun of favorite basic links - hopefully others can post some too. Here go 3 variations of forecast and wind & squall nowcast (wind reading can't be understood unless you see if a squall sits over it, making the reading look artificially good or bad).
SIMPLEST ->wind now ->squall map ->guru forecast
ALT1 ->iwind now ->rainmap ->marine forecast
ALT2 ->uwind now ->cloud motion ->research forecast
Or if you want one stop writeup ->afdhfo Or want to talk to a local forecaster ->biennial october open house (go to soest lab tour and ask how we can get continous or more timely readouts of wind sensors, or how to tell when Hawaii portion of satellite wind data is fresh).
The Turtle Bay webcam is useful to scan the sky towards Kahana. You can request control of the camera for a period of 45 seconds at a time. Unfortunately, it takes up the entire 45 seconds you're granted to spin the camera around to the angle you want. By the time you get there, you really don't get a very long look at it. Here's a way around that :)
1. Go to Turtle Bay Webcam
2. Paste the following text into your address bar and hit ENTER: javascript:void(speed=100)
3. Use the camera as normal. it will rotate twice as fast, giving you more time to scan the horizon. You'll only need maybe 6 or 7 clicks to the right to spin around towards Kahana. Be careful, it's easy to overdo it and go too far.
Have fun!
-Jeff
P.S. - A lot of time when I use this cam, there is some other creep queued in front of me zooming in on blurry women in bikinis. You'd think the internet has more to offer in that department than this little cam.
Quite sharp daytime satellite pictures
-> statewide
-> Oahu
If timestamps aren't expired, can see pretty good cloud detail. Long plumes from mountains often appear, maybe suggesting wind direction. Esp the statewide version gives context, such as Oahu potentially being wind shadowed by Molokai or big island.
Finally they just put a couple wind sensing buoys upwind of Oahu. Until ikitesurf decides to show them, you can peek at
-> ARES buoy-> AMPS buoy
Good view of fronts, Highs and Lows:
http://www.prh.noaa.gov/hnl/graphics/npac.gif
Here's a pretty lo-res wind visualization (stick to blip-map for real predictions):
earth.nullschool.net
State Scale 3-day "Blip Map"
Bellows Wind -> belwind
Bellows wind seems updated here first, currently at 25 min after every hour. Subtract 10 to get Hawaii time... I set the sort order to put most recent to the top. Beware of some sites which are slow or entirely miss some of these readings.
Diamond Head area wind -> sensors
Scroll down to the map of sensors and zoom out with the "-" button. This gives an array of amateur realtime wind sensors from the airport to Kahala, often in weird windshadows. But when the wind is onshore, they seem to give more reliable readings that in total might tell if DH is workable.
Second best Oahu wind map: http://www.soest.hawaii.edu/MET/Faculty/wrf/arw/arw_oahu.html
Hey!Thanks for the update! Though I use featured Weather measuring instruments for weather forecasting ,it was really helpful for me.
Above post by hitlar appears to be spam. Anyway I have refreshed my Oahu Weather page with an emphasis on sailing small boats, but especially the last column and last row have a ton of windward and leeward WX links that flyers may find useful: Oahu coastal WX
New links for 2019:
Forecast text: https://forecast.weather.gov/product.php?site=HFO&issuedby=HFO&product=AFD&format=txt&version=1&glossary=1
NP Surface Analysis: https://www.weather.gov/images/hfo/graphics/npacloop.gif
Bellows hourly sensor: https://www.weather.gov/hfo/display_arc#ar23
Bellows plot of 20min readings (greater frequency, but sometimes more delay) https://mesowest.utah.edu/cgi-bin/droman/time_chart_dyn.cgi?stn=BELH1&unit=0&hours=25&past=0&day1=0&month1=&year1=&hour1=00&time=LOCAL&var=WND&level=
Graphical Products: https://www.weather.gov/hfo/gfe_graphics
Satellite loop https://www.weather.gov/images/hfo/satellite/Hawaii_IR_loop.gif
Post a Comment